Excel Agents in Brightwave
.png)
Every deal team has the same bottleneck. The data is sitting in the room- income statements across 30 portfolio companies, customer transaction logs spanning three years, quarterly financials buried in CIMs. The analysis isn't hard. Getting the data into a model is what takes all day.
ChatGPT and Claude can summarize a document. They can answer questions about a spreadsheet. But ask them to build a working financial model from source data, with real formulas, linked assumptions, and sheets that actually calculate, and they hit a wall. You get hardcoded numbers. Static tables. Values with no lineage back to the source.
Brightwave's Excel Agents work differently.
Real Formulas, Not Hardcoded Values
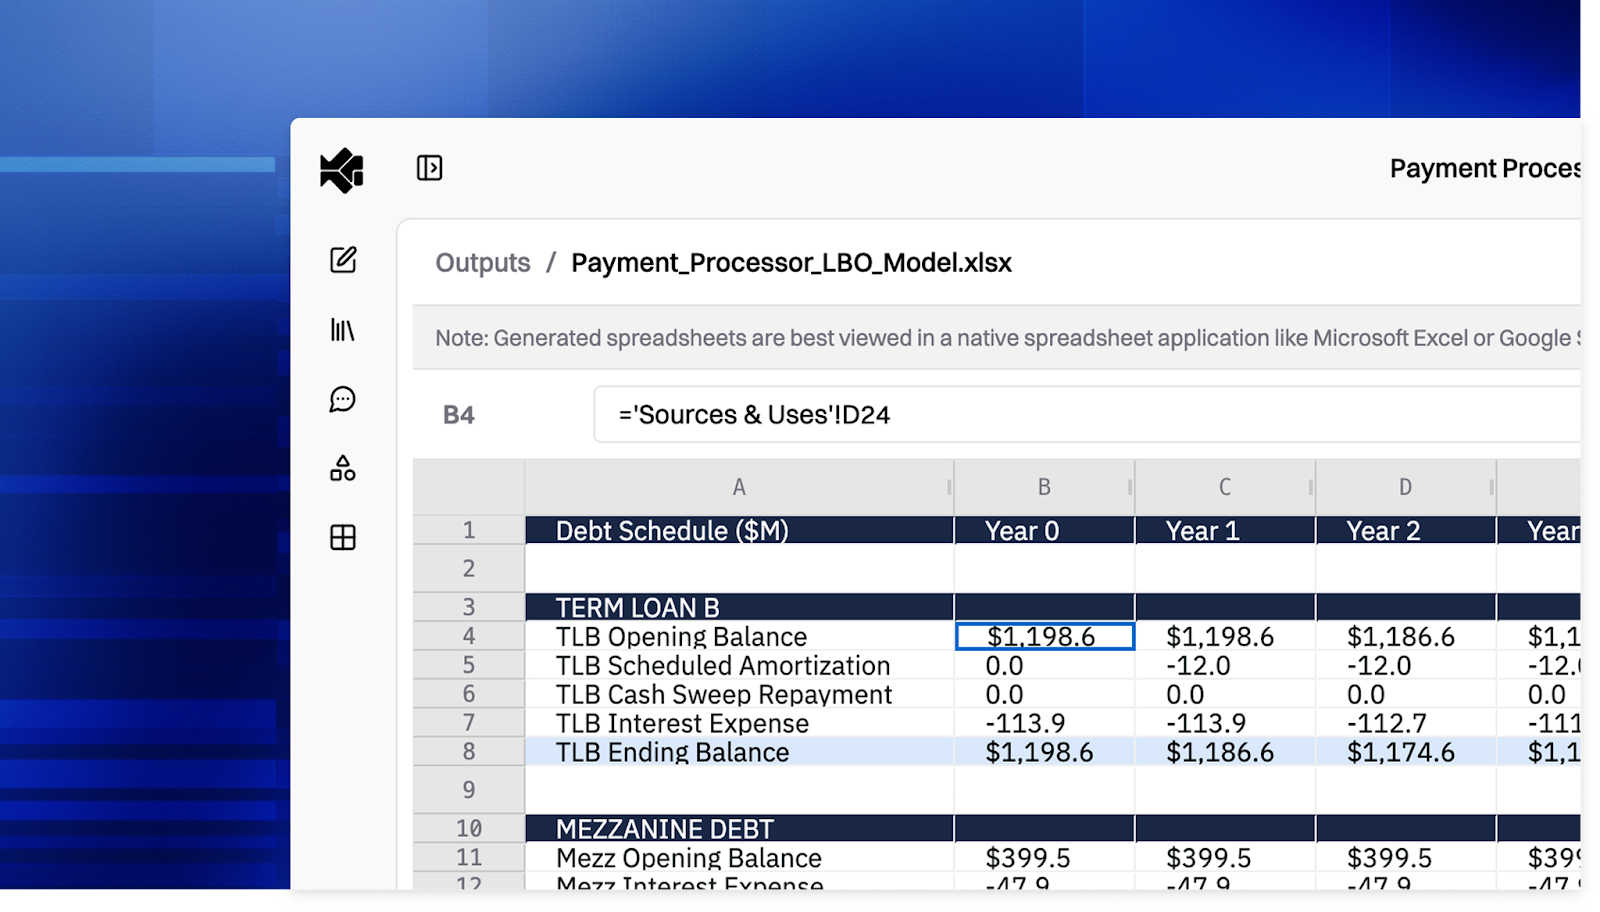
When Brightwave builds a spreadsheet, every calculated cell contains a live Excel formula, not a number pasted in by an LLM. Revenue growth rates reference the revenue cells. Quarterly rollups sum the monthly inputs. Change an assumption and the entire model recalculates.
This is the fundamental difference. Most AI tools treat spreadsheets as output formats or containers for dumping static results. Brightwave treats them as working models, built with the same formula-first discipline an analyst would use.
Every generated workbook goes through automated validation before it reaches you. Brightwave's evaluation system catches formula errors (#REF!, #DIV/0!, #VALUE!) and structural issues before the file is delivered, then recalculates all formulas to verify they resolve correctly. If something doesn't check out, the agent fixes it.
Three Workflows That Used to Take Hours
Data Extraction and Aggregation
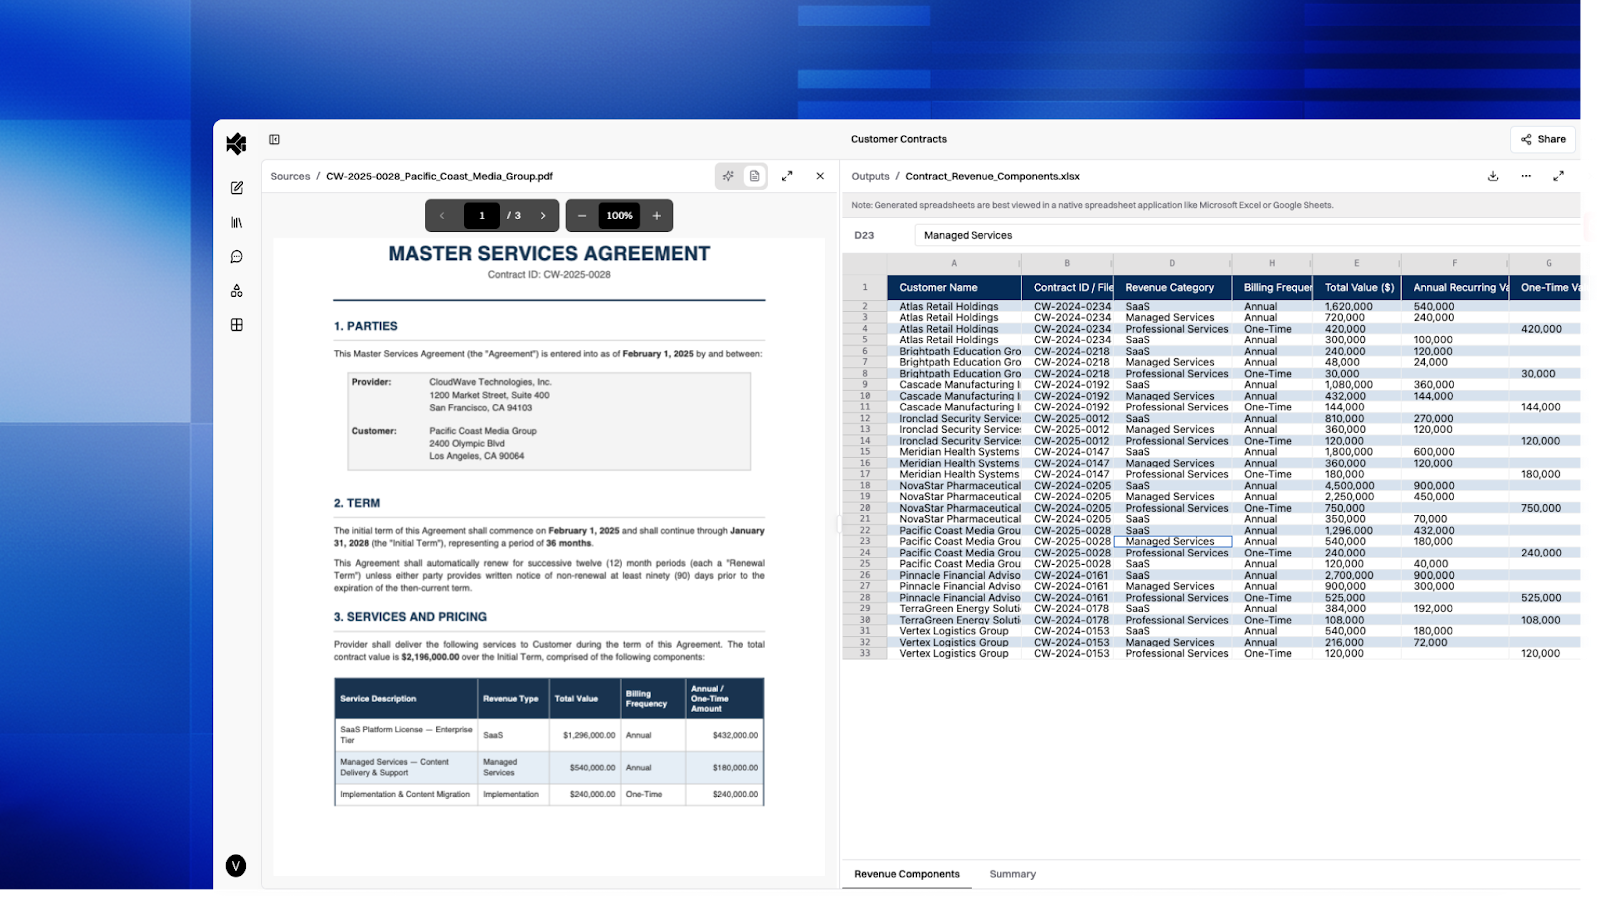
Upload a data room and ask Brightwave to extract the financials into a consolidated model. The Excel Agent reads across your source documents- CIMs, 10-Ks, quarterly reports, customer data tapes- and pulls the relevant figures into a structured workbook with proper cell references linking back to where each number came from.
A task that typically means an analyst opening twenty tabs, cross-referencing line items, and manually building a spreadsheet becomes a single prompt.
Analysis and Data Cubing
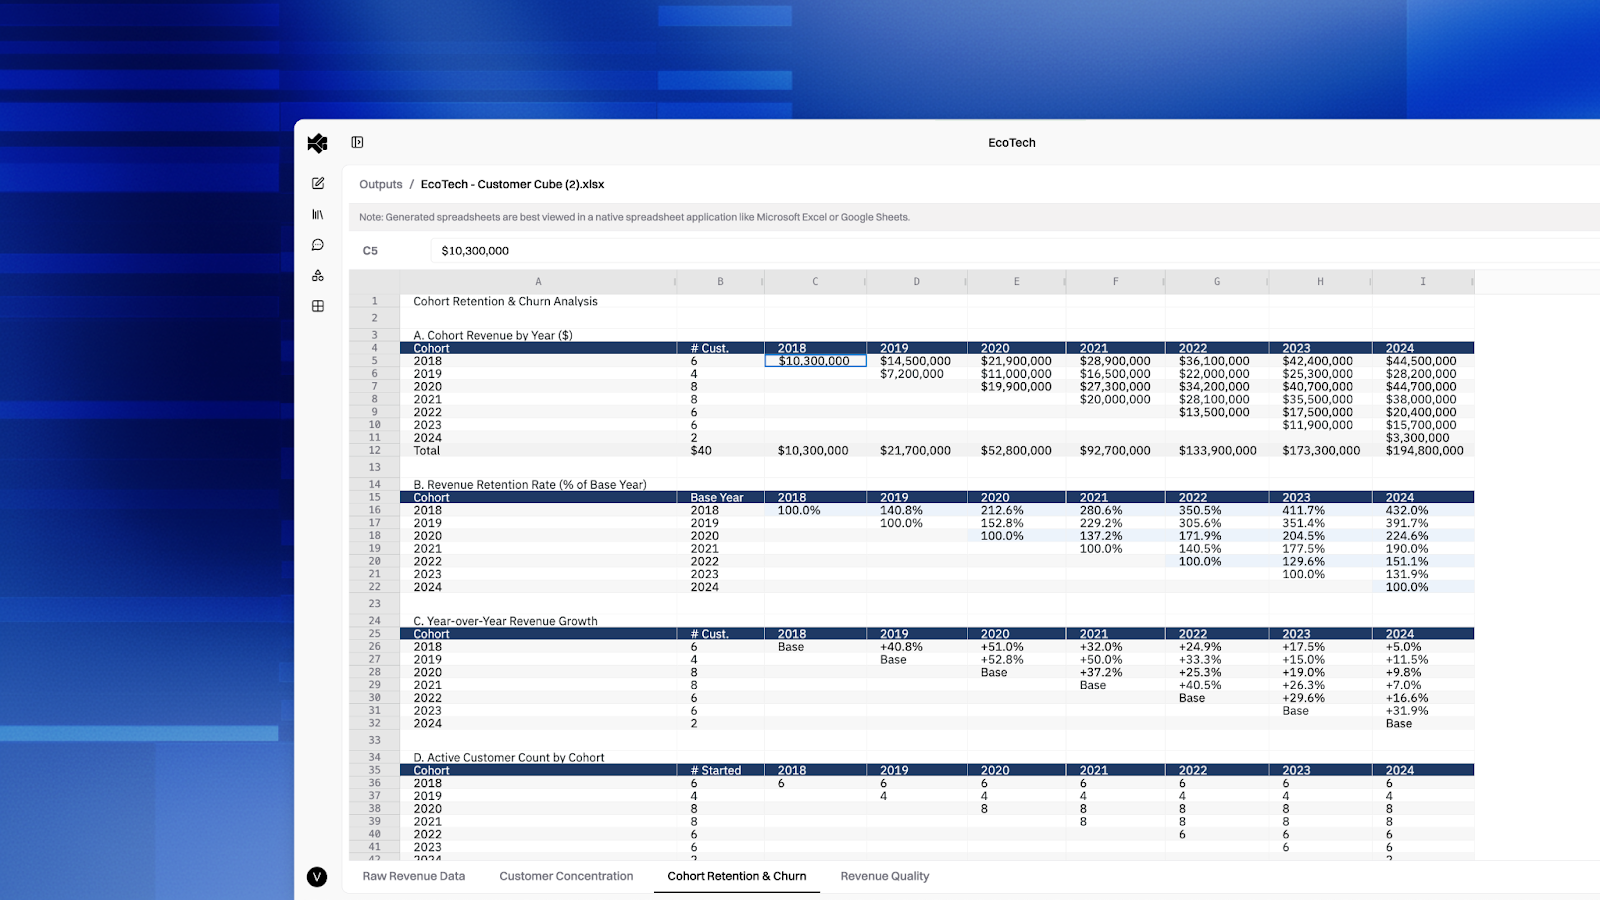
For customer-level transaction data, portfolio operating metrics, or any structured dataset with multiple dimensions, Brightwave can slice, pivot, and organize data into analysis-ready workbooks. Revenue by product line. Usage trends by customer cohort. Margin analysis by segment and time period. Each cut gets its own worksheet, with formulas that tie everything together.
This is the "data cube" workflow. Every data point related to a dimension organized so you can see the full picture without manually building pivot tables or writing SUMIF chains.
Contextualized Model Building
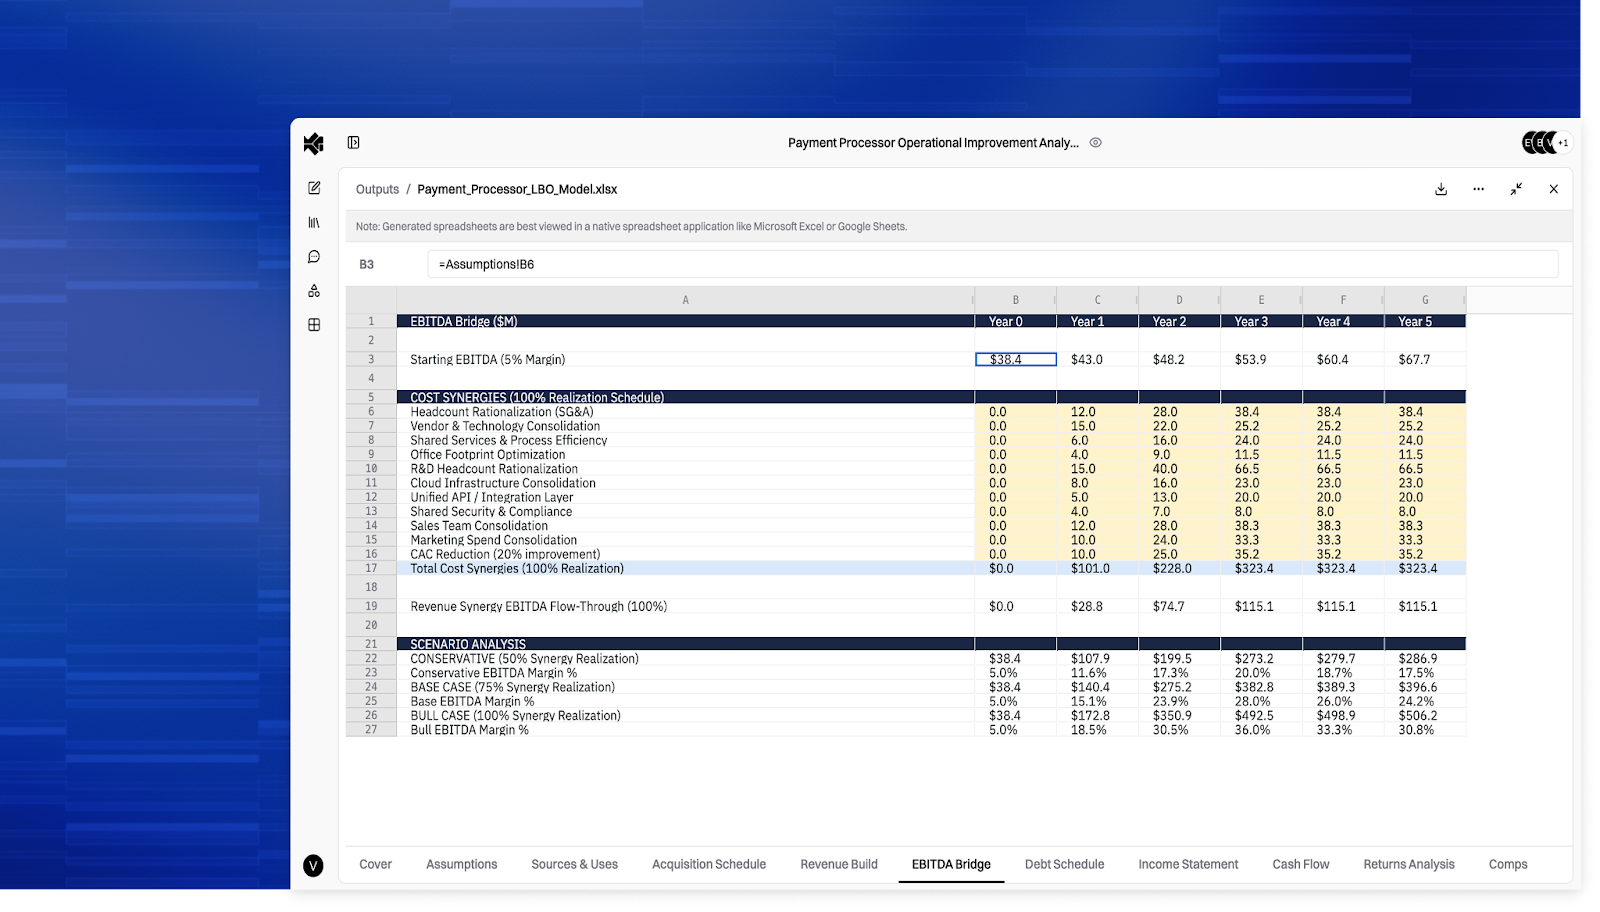
Models aren't just math, they require judgment. Brightwave builds financial models that incorporate context from your data room, external sources, and the specific assumptions relevant to the deal at hand.
Upload a CIM and ask for an operating model. Brightwave inspects the available data, identifies the key financial line items, structures assumptions, and builds a multi-sheet workbook where revenue drivers flow into a P&L, the P&L feeds a balance sheet, and everything traces back to documented assumptions. The model architecture follows standard conventions: one sheet per analysis dimension, annual-to-quarterly-to-monthly column layouts, and derived metrics (YoY growth, margins, mix percentages) calculated from the underlying data.
Every assumption is explicit and editable. Change a growth rate, and the downstream projections update automatically.
Templates: Your Firm's Format, Brightwave's Speed
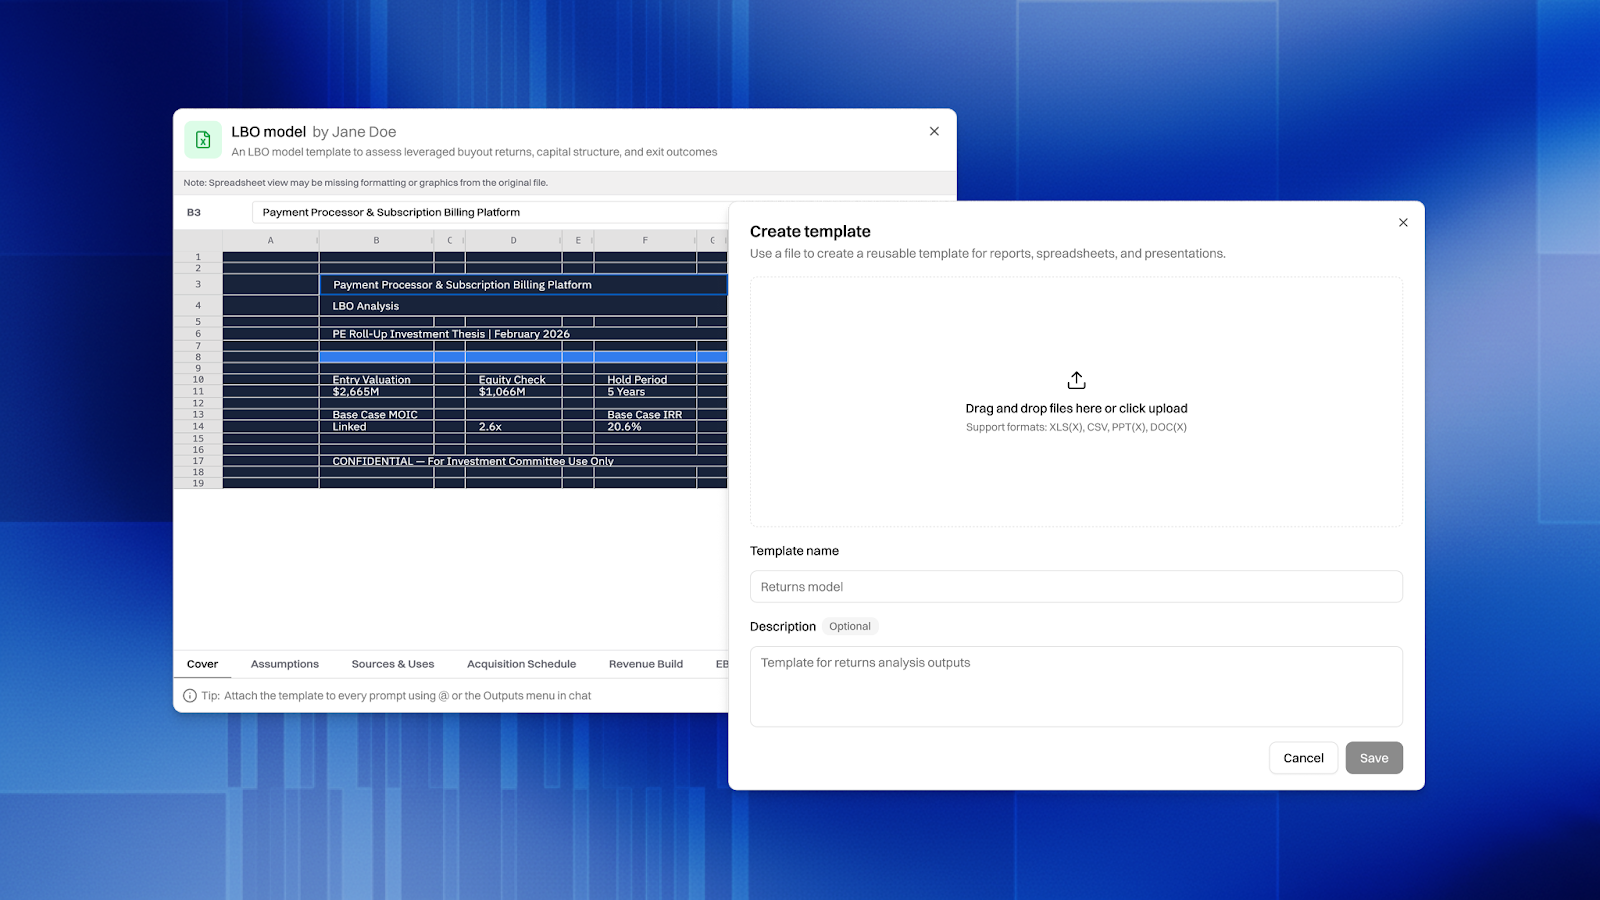
Every firm has its own way of building models. Column layouts, color coding, metric ordering, sheet structure… These aren't arbitrary preferences, they're how your team communicates.
Brightwave's Template Library lets you upload your firm's existing Excel templates and have the agent populate them with data from your research. The agent analyzes the template structure first- sheets, headers, formatting conventions- then fills in the data while preserving everything about how your firm expects to see it. No reformatting. No "Brightwave-style" overrides.
Upload an IC memo template, a quarterly reporting pack, or a standard comp table layout. Brightwave fills it. Your partners see the format they expect with data they can trust.
Built for How Analysts Actually Work
Brightwave's Excel Agent isn't a feature bolted onto a chatbot. It's a specialized system designed for the financial modeling workflow:
Spreadsheet-native citations. When Brightwave references data from a source spreadsheet, it cites the exact cell range: "Sheet 'Q4 Results', cells B5:D10", not a vague page reference. Click the citation and see the source data highlighted in the original file.
In-platform viewing. Review generated workbooks directly in Brightwave. Navigate between sheets, inspect formulas in the formula bar, verify calculations — all without downloading or switching to Excel. When you're ready, download the .xlsx and it works exactly as you'd expect.
Intelligent planning for complex models. For multi-sheet financial models, Brightwave's planning system breaks the work into atomic steps: extract source data, build the assumptions sheet, construct the P&L, layer in the balance sheet, then validate cross-sheet references. Each step is verified before moving to the next, preventing the compounding errors that plague long-running AI tasks.
What This Means
If you're using ChatGPT or a general-purpose AI tool to work with financial data, you're getting summaries and static tables. That's useful for quick answers. But the actual work- the models that inform IC decisions, the analyses that drive deal pricing, the data cuts that reveal customer concentration risk- requires formulas that calculate, assumptions that can be stress-tested, and outputs that your team can build on.
That's what Brightwave delivers. Not AI that talks about spreadsheets. AI that builds them.
See it in action — schedule a trial or ask your account rep for a live demo of the Excel Agent workflow.